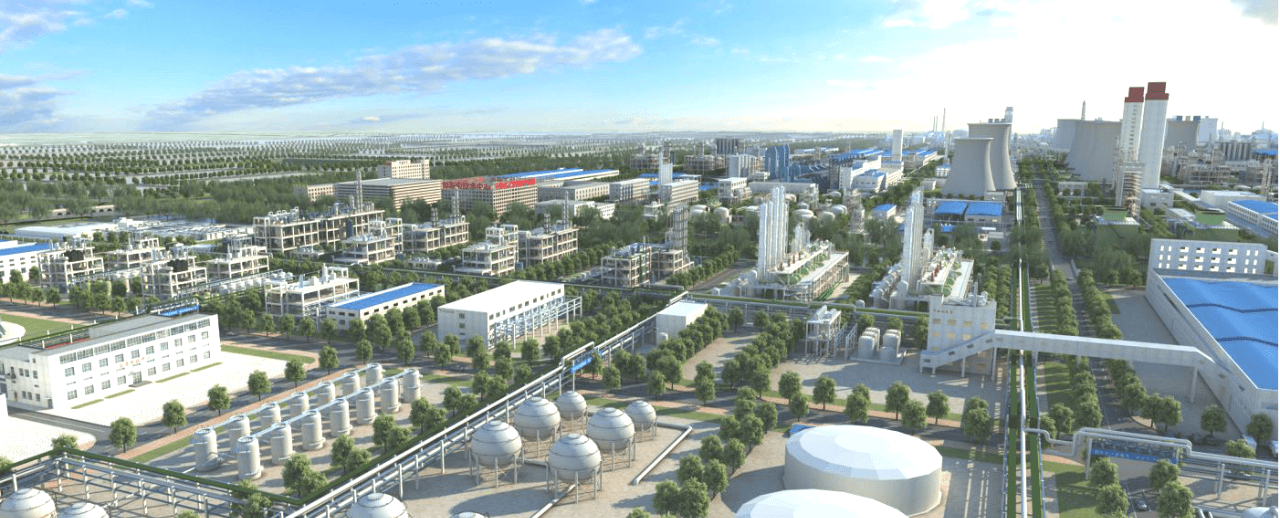
The chemical industry park is the aggregation area of most chemical corporations. During the process of production, the wastewater, exhaust gas and solid emissions were emitted, which cause many problems like poor air quality, safety risks, etc. Also, the environmental supervision capabilities are insufficient in chemical industry parks and the facilities and equipment for centralized treatment of “three wastes” are weak. Therefore, Bivocom combines the difficult points of pollution prevention and control in chemical industry parks to implement a chemical industry park environment monitoring solution. The solution can comprehensively monitor toxic, harmful, flammable and explosive gas and also other factors in chemical parks, such as wind direction and speed, air pressure, rainfall, temperature and humidity, dust, smoke, etc. Through monitoring, the safety risk management and control capabilities of chemical industry parks can be improved.
Problem Analysis
- The system of sewage treatment is not perfect and the supervision of environmental protection departments is not in place. The problems include the low supervision ability, the lack of professional skills of the supervision personnel, and the imperfect monitoring system.
- The early-developed chemical industrial park adopted a traditional monitoring method. Its low informatization causes a high cost of monitoring and low efficiency.
- The emergency plan of the chemical park is not established on the basis of the investigation of enterprise environmental safety hazards and the construction of emergency materials disposal capacity, which lacks scientific and practical.
System Solution
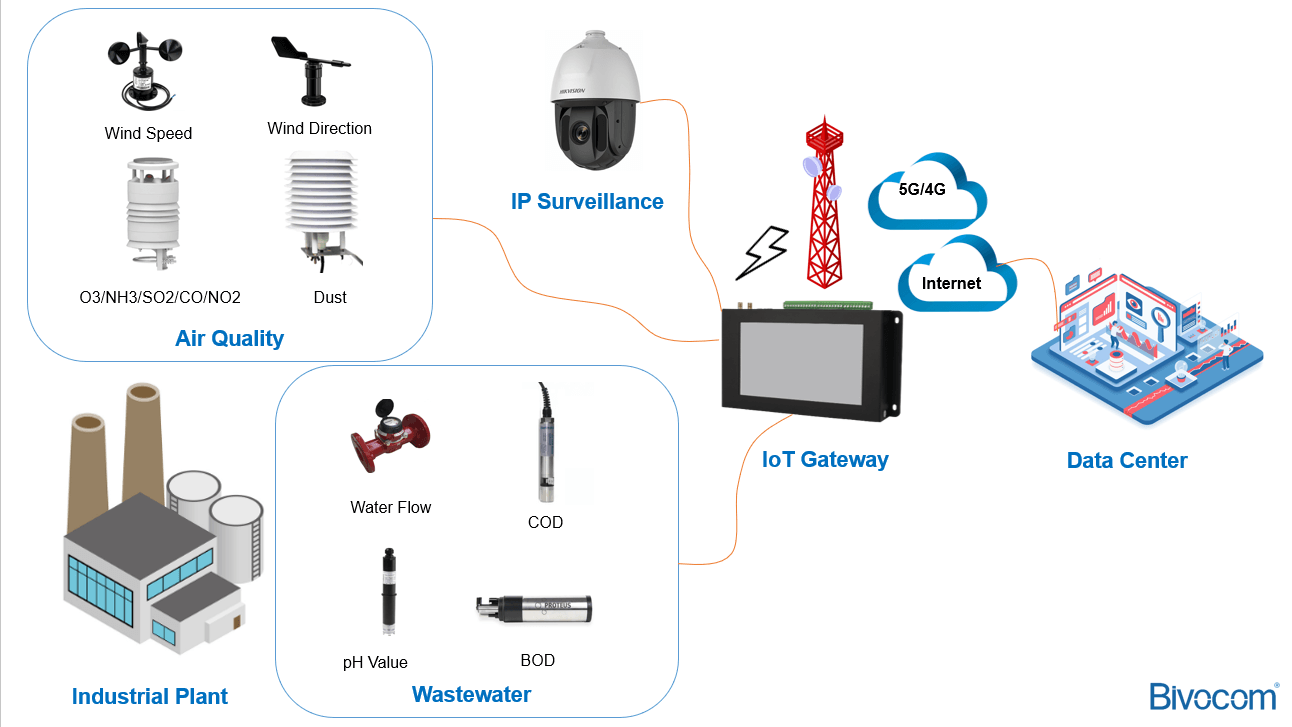
Bivocom provides solution to alleviate the environmental quality problem of chemical industry parks. This solution makes full use of technologies of IoT, cloud computing, big data, etc. Forming an infrastructure smart data network that improves the sensing and early warning management of chemical industry park efficiently. The monitoring solution can monitor, collect, transmit, and warn the data of environmental pollutants, like SO2, NO, NO2, inorganic acid, inorganic and salt mud, etc. in real time. In this way, the environmental quality of industry parks can maintain a good state.
This solution consists of sensing devices, industrial IoT RTU, center server and web system. There is a working process for this system. Firstly, the sensors connect with industrial RTU and collect environmental data of chemical industry parks in real time. Secondly, the data will be sent to the center sever through 5G, WIFI, NB-IoT, etc. Thirdly, the server store and analyze the data. Finally, the app or PC ends will shouw the data which helps managers learn more about the environmental quality state of the park.
Solution Functions
-
Data Monitoring
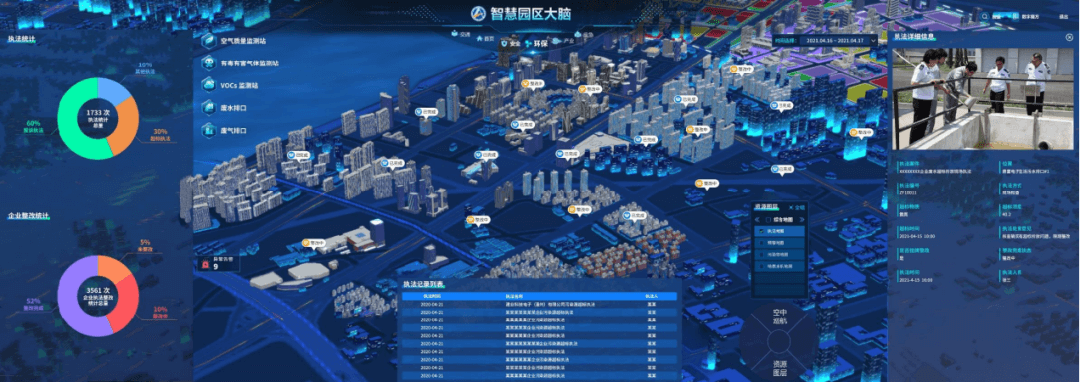
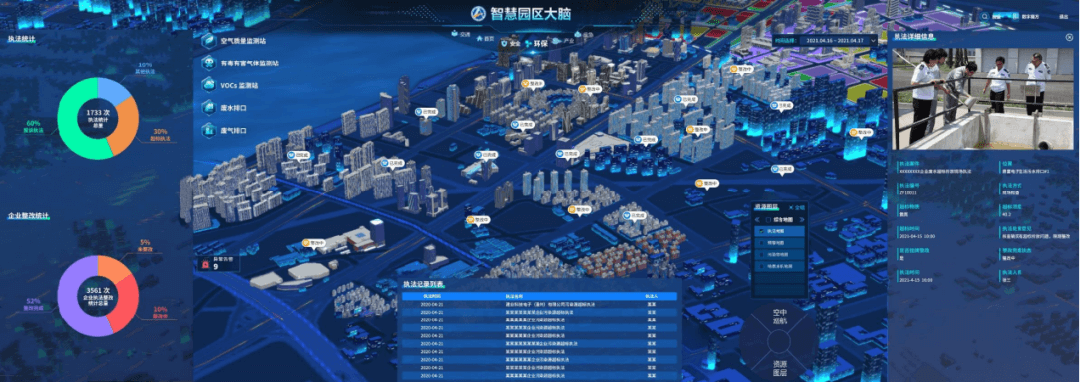
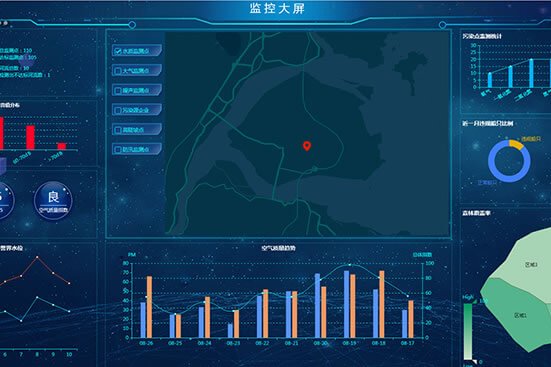
Real-time display of equipment status, reporting time, wastewater, waste gas, waste slag, and other data reported by the equipment and summarizing statistics of the above information data in the form of charts.
-
Intelligent Analysis
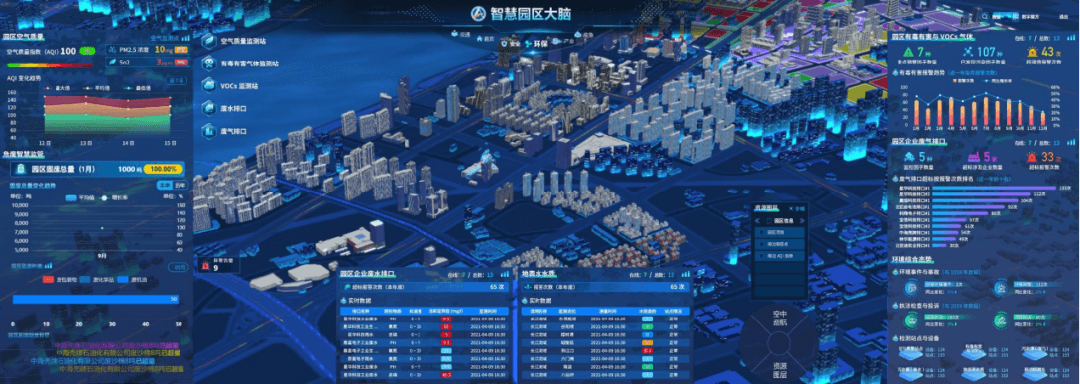
Conducting data analysis and modeling in the chemical park according to the monitoring points, types of regulatory environmental protection data, monitoring time and other dimensions. And then it can comprehensively display the real-time data, monitoring standards, and video data in the form of statements, and analyze and display the actual data and index data of waste gas, waste residue and wastewater in the chemical park. Horizontal and vertical comparisons of the same series of data are supported to meet the analysis requirements of early warning and intelligent management.
-
Alarm Management
Set the maximum threshold for waste gas, waste slag, and wastewater, and display the alarm device, alarm time, and alarm type in a list in real time. When the monitoring data is higher than the maximum threshold, an alarm signal can be issued to remind the management to deal with it in time.
-
History Tracking
It supports to query data such as historical statistics records and historical mean values, and collect the maximum value, minimum value, and time label of variables in the query period. What’s more, system can view the out-of-limit running time of variables and their values, and perform summary statistics and export. Therefore, these data support for managers to make scientific decisions.


Comment